This page is not compatible with Internet Explorer.
For security reasons, we recommend that you use an up-to-date browser, such as Microsoft Edge, Google Chrome, Safari, or Mozilla Firefox.

Seamless Workflow from CT Scan to Statistical Analysis
Volume Graphics is extending data export to the statistics software Q-DAS qs-STAT from its software for non-destructive testing based on industrial computed tomography (CT). This close cooperation between Volume Graphics and Q-DAS, which are now united under the roof of Hexagon, a leading global provider of sensor, software and autonomous solutions, takes automation to the next level: statistical evaluations can now be fully integrated into the workflow.
Many users want to statistically analyze the quality data of their components. Especially for automated applications, this is often a basic requirement. Q-DAS solutions, such as the Q-DAS qs-STAT package, are considered to be the de facto standard for statistical analysis. Volume Graphics had already implemented an option for data export to the Q-DAS software in Release 3.3 of VGSTUDIO MAX. But now, as part of Hexagon Manufacturing Intelligence, Volume Graphics and Q-DAS are working on making the data exchange between computed tomography and statistics even tighter.
A first result of this collaboration is the option to also export 3D representations of components or measured features to Q-DAS software. This option will be introduced with version 3.4.3 of VGSTUDIO MAX, VGMETROLOGY and VGinLINE. In practice, the user simply marks the relevant box in the export mask. The software then adds the corresponding part image to the data to be exported. Users can make their reports, which they define and access with Q-DAS qs-STAT, for example, even more transparent. They can immediately see which measurement series belongs to which detail (see image).
"Currently, the export of 3D component representations from our coordinate measuring module is possible, i.e. in connection with measurement data," explains Johannes Knopp, Product Manager Automation & Inline at Volume Graphics. "But it does not stop there. Our development department is already working on including additional results from the array of gray-value-based material analyses, such as defect analyses, in the export functions. The aim is to realize a seamless, fully automated workflow for all CT quality data."
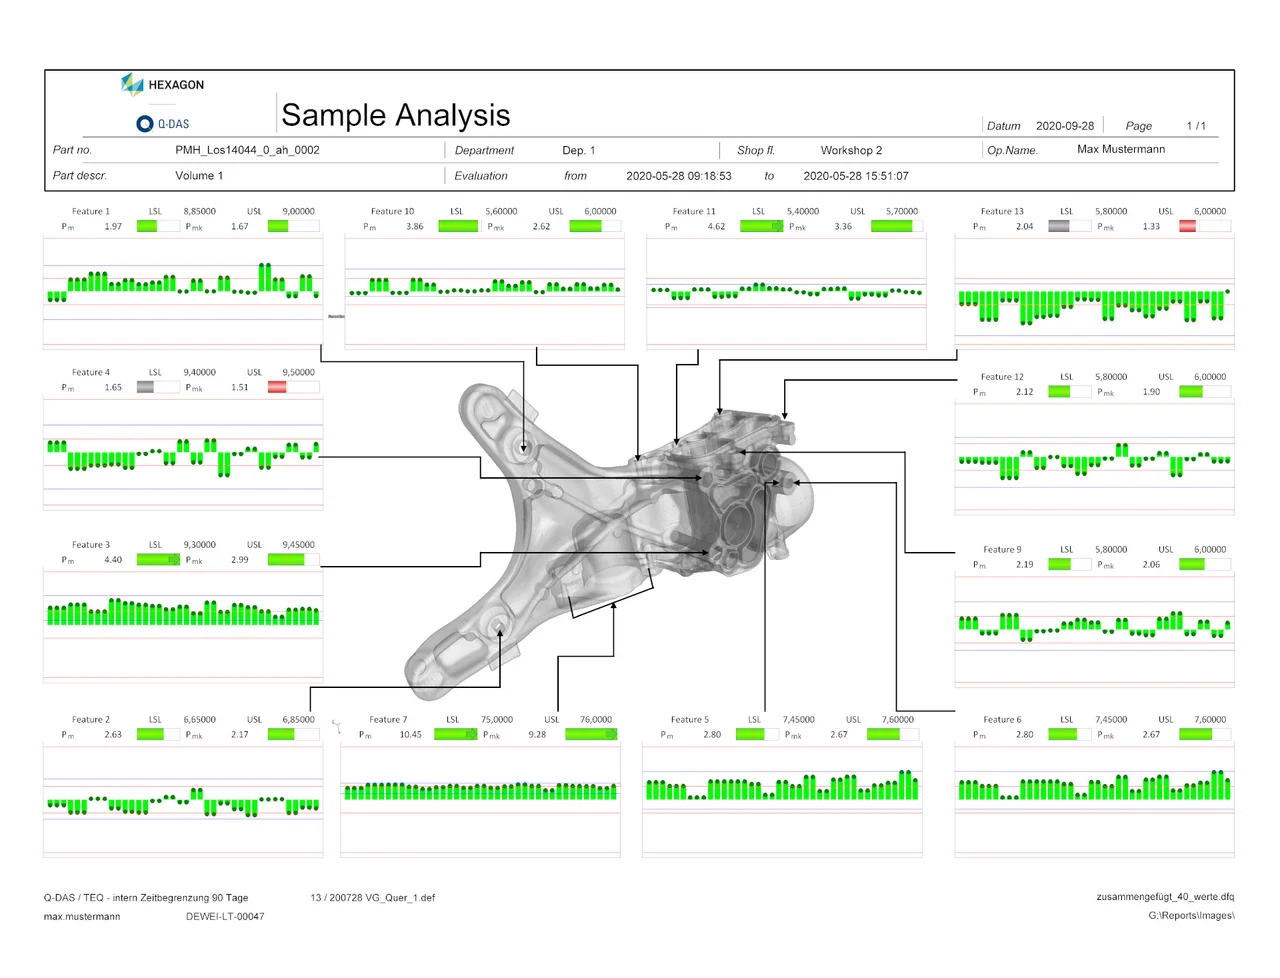
If the respective export option is activated, Volume Graphics software transfers not only the measured values, but also an image of the component to the Q-DAS qs-STAT statistics software package. This enables the dimensions to be clearly linked to the corresponding detail in the report.
About Volume Graphics and Hexagon
Volume Graphics GmbH has been developing software for non-destructive testing based on industrial computed tomography (CT) for over 20 years. Customers around the world, e.g., from the automotive, aerospace, and electronics industries, use Volume Graphics software for quality assurance in product development and production. In addition to its headquarters in Heidelberg, the company has branches in the USA, Japan, Singapore, and China. Learn more at www.volumegraphics.com and follow us @volume_graphics.
Since 2020, Volume Graphics has been part of Hexagon. Hexagon is a global leader in sensor, software and autonomous solutions. We are putting data to work to boost efficiency, productivity, and quality across industrial, manufacturing, infrastructure, safety, and mobility applications. Our technologies are shaping urban and production ecosystems to become increasingly connected and autonomous – ensuring a scalable, sustainable future.
Hexagon (Nasdaq Stockholm: HEXA B) has approximately 20,000 employees in 50 countries and net sales of approximately 3.9bn EUR. Learn more at hexagon.com and follow us @HexagonAB.