This page is not compatible with Internet Explorer.
For security reasons, we recommend that you use an up-to-date browser, such as Microsoft Edge, Google Chrome, Safari, or Mozilla Firefox.
3D Metrology
With Computed Tomography
3D Metrology for Complex Geometries
The enhancement of industrial manufacturing leads to more complex parts. Organic shapes, miniaturized geometries that are hard to be measured with touch probes, and inner structures such as lattices in 3D printing can’t even be measured with optical scanners.
The Challenge
To offer fast, stable, and accurate ways to qualify even more complex outer, but also inner geometries, metrology has to keep up with the industrial enhancements in design and manufacturing.
The Volume Graphics Solution: Accurate Metrology on CT and Optical Scans
Quality control, product development or directly within production: VGMETROLOGY, VGMETROLOGY ES, and VGSTUDIO MAX — the latter equipped with the Coordinate Measurement Module — are universal software packages for the analysis of 3D measuring data from industrial computed tomography scanners (CT) and optical scanners for quality control, product development, and production. Volume Graphics software is used worldwide by customers in the automotive, aerospace, electronics, medical devices and consumer goods industries for first article inspection reports, automated batch processing, and even inline process control.
The easy-to-use stand-alone applications turn your CT scanner into a comprehensive and precise X-ray metrology device. The software gives you the most precise picture of all objects’ surfaces you can get – and saves it in the very compact .mvgl format. This provides the most accurate metrology on original CT data with no trade-off between file size and the quality of information.
Advantages
Metrology software from Volume Graphics gives you maximum accuracy and an efficient workflow—all while being hardware independent:
Accurate
- Unique locally adaptive and subvoxel precise surface determination, with accuracy verified in numerous studies
- Surface representation directly on the CT data — no loss of accuracy from conversion to a surface mesh
- PTB and NIST verified fitting of geometry elements on CT data
Efficient
- Import of PMI measurement plans directly from CAD models
- Automated replication of measurement plans across periodic structures
- Automated execution of measurement plans and reporting both in the lab/office and in production
- Compact file format for efficient worldwide sharing of data
Universal
- Hardware independent — can be combined with almost any CT or optical scanner
- Handles voxel, point cloud, and mesh data
- Leading software for all industrial CT analyses, including metrology, defect analyses and material structure analyses
The Volume Graphics Solution in Detail
Data Import
Import of CT Data: Quickly and precisely import CT data from any industrial CT using raw volumes, image stacks, and many native formats. The visualization is based on the native voxel format. Also, all metrology functions work losslessly directly on the native voxel data. The advanced surface determination provides a minimum measurement uncertainty.
Handling of CT Data: The compact .mvgl format enables 95% smaller file sizes compared to data sets with gray values without the loss of surface information.
Import of CAD models: Neutral CAD formats such as STEP, IGES, and JT can be imported into VGSTUDIO MAX at no cost. For the import of native formats such as NX, Catia, Creo, Inventor and SolidWorks, an add-on module is available for a fee.
Import of CAD and PMI Data: The ability to import Product Manufacturing Information (requires the CAD Import with PMI Module) by semantic usage of Model Based Definition streamlines the manufacturing of parts. It eliminates reauthoring, saves time by reusing already applied GD&T information, and reduces chances of errors.
Import of Point Cloud and Mesh Data: Point clouds and meshes can be imported for metrology and visualization. Measurement plans work seamlessly on CAD, CT, and mesh data. Mesh import includes .stl, .ply, and .obj, including color if available.
With the corresponding add-on module, VGSTUDIO MAX understands additional information stored in PMI data
Alignment
Alignment enables the extraction and comparison of nominal and measured dimensions and the checking of assemblies. The Volume Graphics inspection software provides the ability to align any data set to a reference data set or a coordinate system:
- Surface-based alignments such as (local) best fit and feature- (character-line-) based fits for symmetric parts
- Geometry-element-based alignment such as 3-2-1 and sequential alignment
- Reference point alignment such as RPS and datum targets
Geometry-element-based alignments can be combined with local best fits in order to simulate any real world alignment problem as well as to constrain rotations and translations by features or regions.
Volume Graphics supports custom and local coordinate and datum systems, providing automated measurement update when changing alignments.

Volume Graphics software provides the ability to align any data set to a reference data set or a coordinate system
Dimensional Analyses
Smart expand offers a one-click definition of geometry elements, enabling the fast creation of geometry elements using Gauss and Chebyshef fits and various fitting filters.
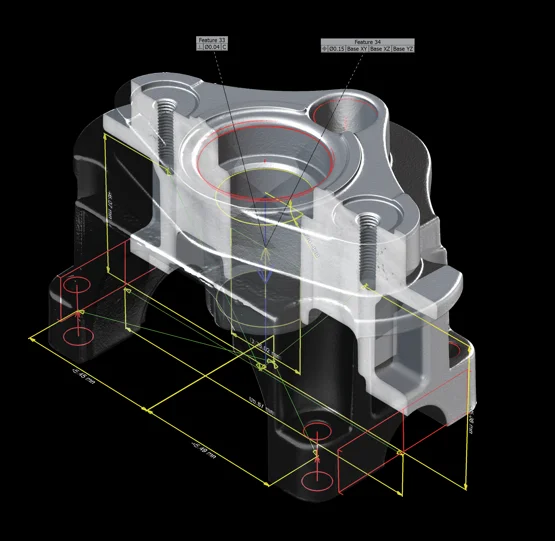
Dimensions such as distances, angles, and radii can quickly be derived—both in 2D and 3D—by selection on the screen, in the Scene Tree, and in the tabular overview of all elements with sophisticated filter functions for very large measurement plans.
Instruments can be used for quick point-based distance and angle analyses and annotations.
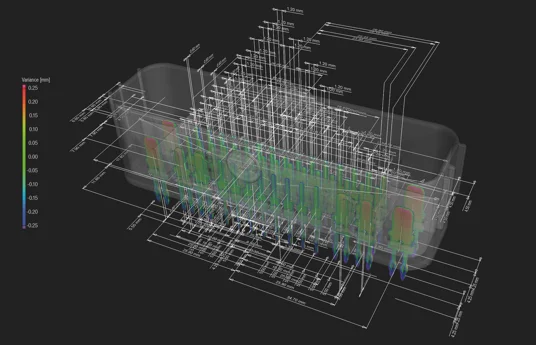
CT metrology in a 3D view
Surface Analyses
Nominal/Actual Comparison: Color-coded comparisons between any datatype provides easy-to-understand visual information of deviations. Manual or automated, rule-based annotations provide local point- or area-based information, for example, locating the three largest deviating areas or a specific number of predefined points.
Wall Thickness Analyses (only in VGSTUDIO MAX with Wall Thickness Analysis Module): Evaluation of wall thickness using the directional method for cubic parts and a sphere-based method for complex, organic geometries.
GD&T: Volume Graphics supports all 17 GD&T callouts, such as line and surface profile as well as position with maximum material requirement (MMR). Local coordinate and datum systems support sophisticated geometry analyses.
Volume Graphics supports ISO and ASME standards, continuously implementing updates of the standards.
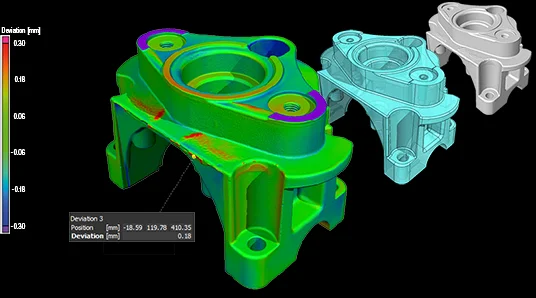
Compare your scanned object with its respective CAD data set. Get color-coded results of deviations and local annotations
Automation and Reporting
Automation: Volume Graphics software can be fully automated for multi-part usage using macros and batch processing, but also for inline applications.
Reporting: The reporting allows creating customized reports including dimensions, 2D and 3D analyses, GD&T callouts, snapshots of sections and the 3D model, rule-based images of features in and out of tolerance, histograms, and tables. The results can be visualized and exported as an Excel or .pdf file. The report templates can be edited and re-used for similar data sets or customers.
Viewer: The free viewers enable a seamless communication with your internal or external customers. Where myVGL is a pure viewer application, VGMETROLOGY VIEWER enables you to change alignments, add dimensions, and get even more insight into an already inspected data set.
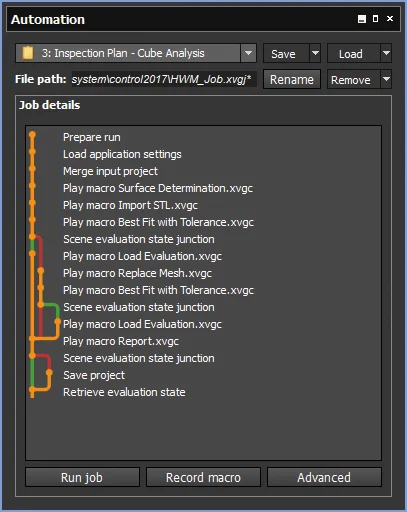
VGSTUDIO MAX ist your central automation editor