
What is Directional Variability?
Directional variability shows us how analysis values change and how they change along a specified direction.
Let's take porosity as an example. The results are displayed in a line graph, which is useful to check for patterns and trends along a given axis. For example, if porosity increases from the bottom upwards, it may be worth examining and adjusting the casting process. This also makes sure that, while an overall part is allowed a porosity of 2%, there is no one region that surpasses 2%—especially if it is functionally critical.
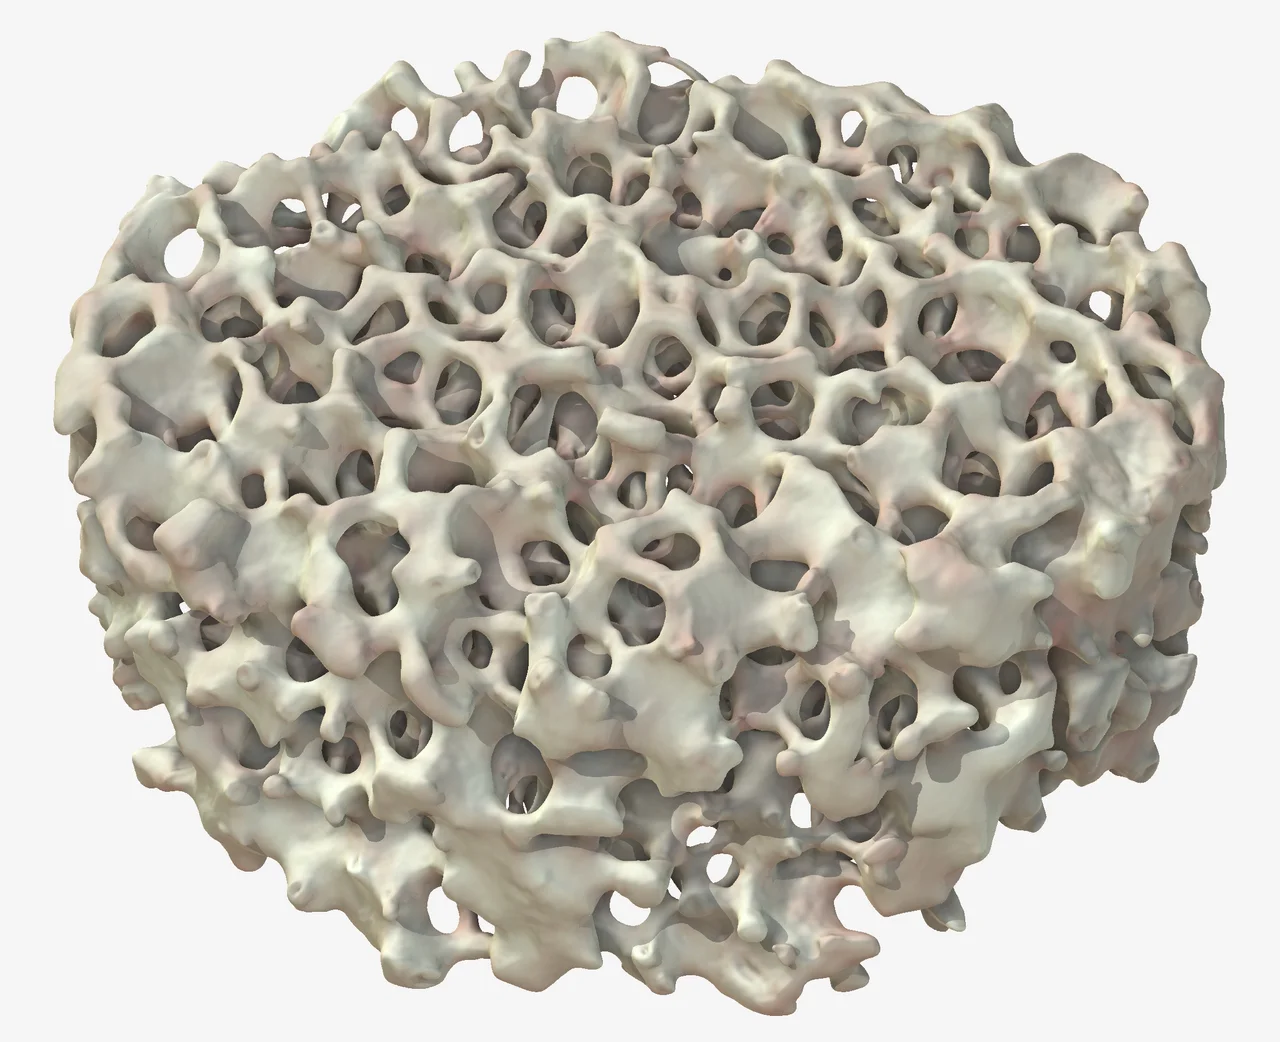
Too abstract? Let's work with something known—and one might argue, important for—the size of its cells: a ceramic foam filter that is used in metal casting.
Ceramic Foam Filters for Casting
Even the slightest non-metal impurities can have a devastating effect on the performance and strength of a part.
Because these foam filters are made of ceramic, they can withstand extreme heat and harsh conditions to filter out impurities in molten metal. They also prevent gas bubbles from forming by "calming down" the molten flow. As such, they demand precision performance, which relies almost entirely on the size of the foam cells.
Ceramic foam filters prevent impurities in molten metal from passing through
The ceramic foam filter is placed into a sprue, where it prevents impurities from passing into the mold. It also changes the liquid metal flow from turbulent to laminar, which ensures it flows in a fluid, parallel motion, with no disruption (mixing) between layers.
For the filters to maintain high performance, durability, and heat resistance, the production line must undergo quality control to ensure even (foam) cell size and distribution—and all of this from top and bottom, along the cylinder's axis. It is crucial that the foam cells fall within a specific size threshold for the filter to function optimally.
Directional variability is available for foam/powder analysis, porosity/inclusion analysis, and gray value analysis. Note that it will always be calculated for foam/powder analysis. For the other two, just check the "directional variability" option and set the direction.

Check the option for directional variability and set the direction
This opens up the "directional variability" tab, where we can later examine the results more closely.
To double-check, we can also perform a porosity/inclusion to see if there are any patterns in porosity distribution, and gray value analysis to make sure that there are no significant pits in the graph that may indicate microporosity or cracks in the cross-section.
Now let's take a closer look at our analyses, starting with foam/powder analysis.
Foam/Powder Analysis
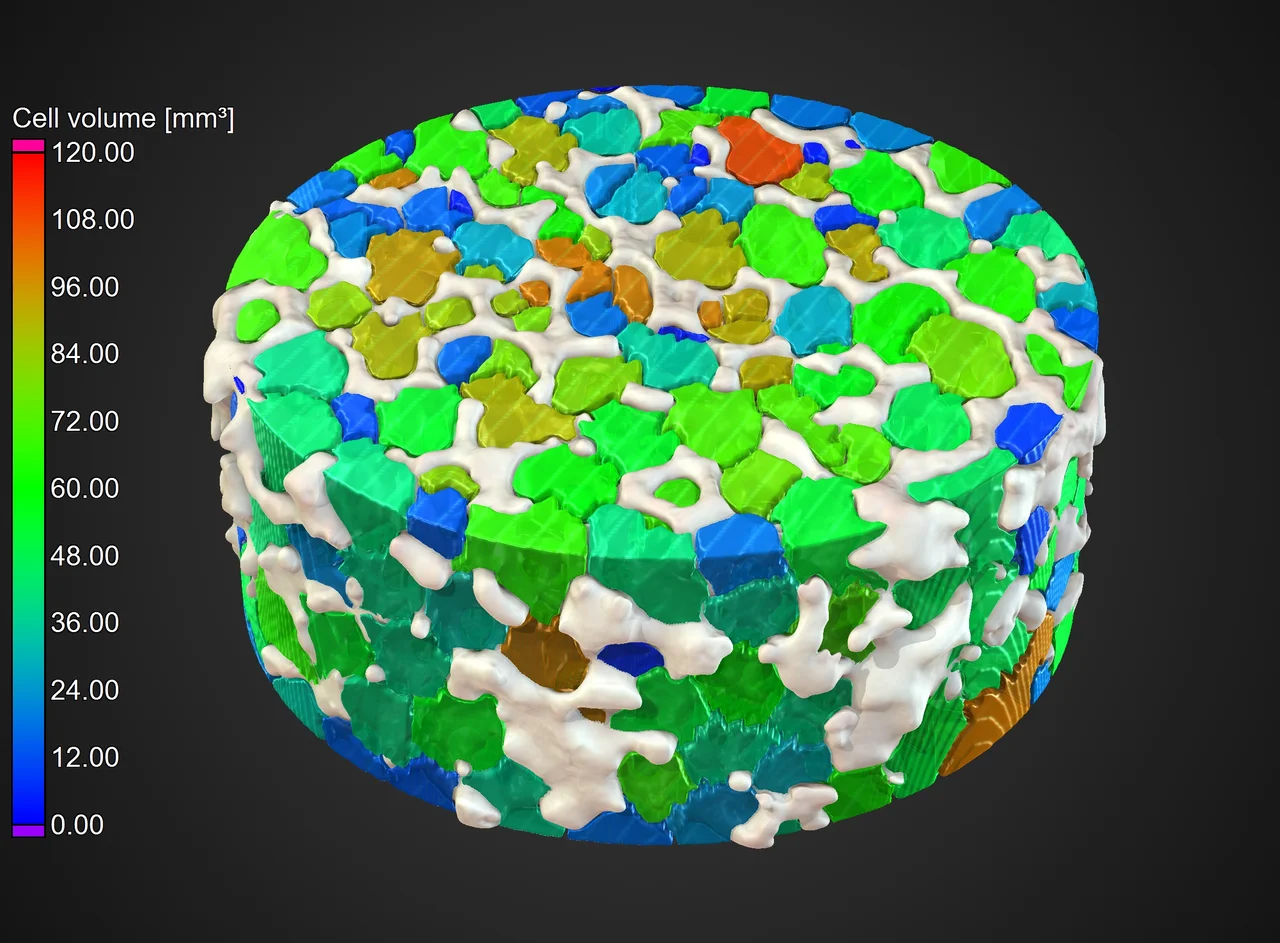
Foam/powder analysis shows color-coded cells sizes of the ceramic foam filter
Directional variability in our foam/powder analysis gives us a line graph that shows how cells are distributed. As we can see, there is an even distribution in the center, with a mean cell volume of around 75 cubic millimeters.
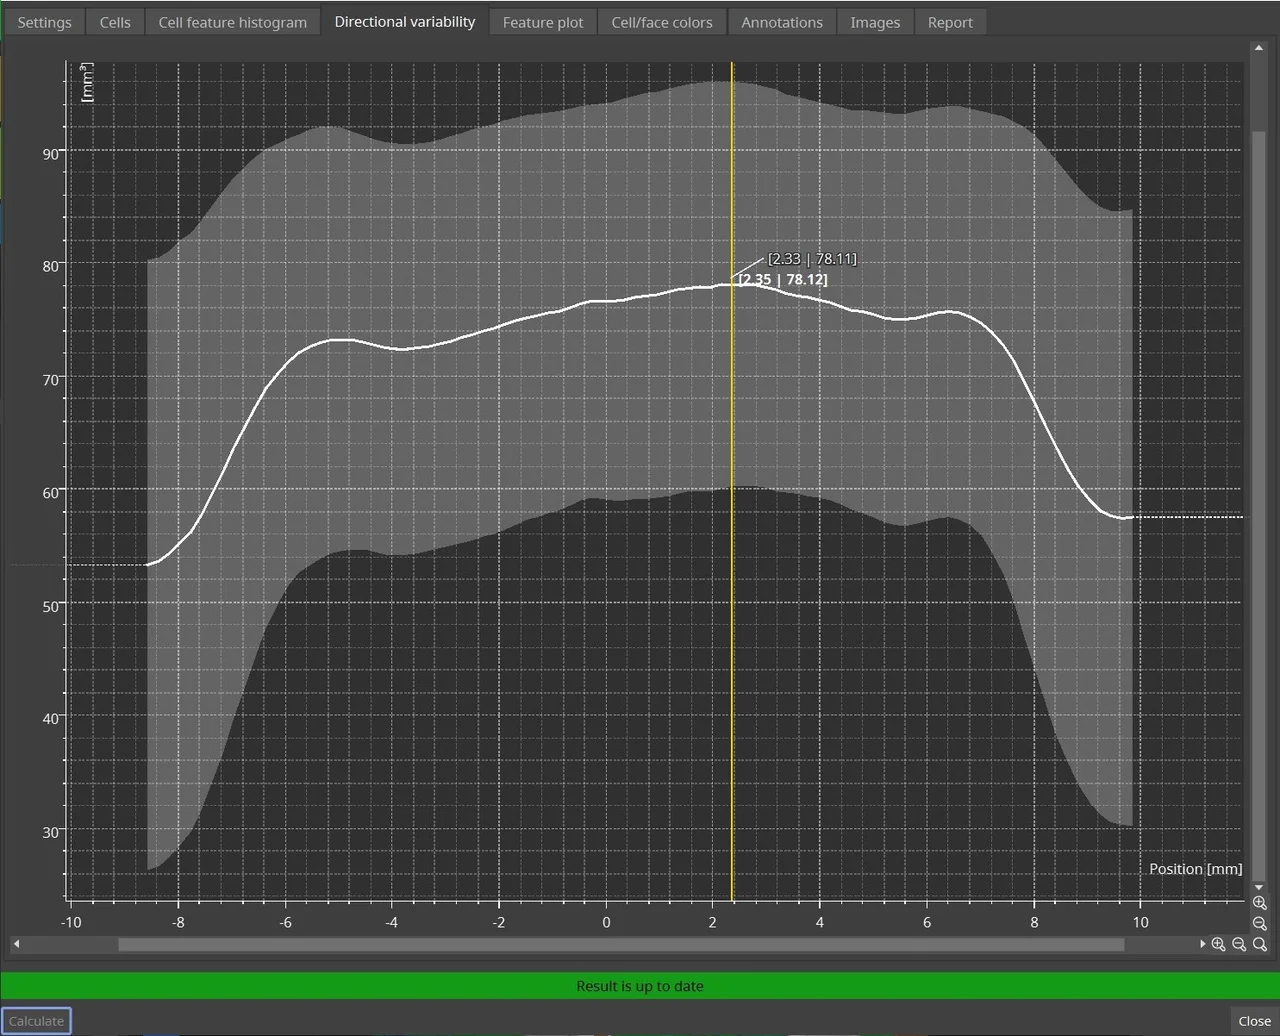
Directional variability graph for our foam/powder analysis of the ceramic foam filter; the mean cell volume is around 75 cubic millimeters

Results of the foam/powder analysis; the distribution appears to be quite even, with a single outlier or two
Porosity/Inclusion Analysis
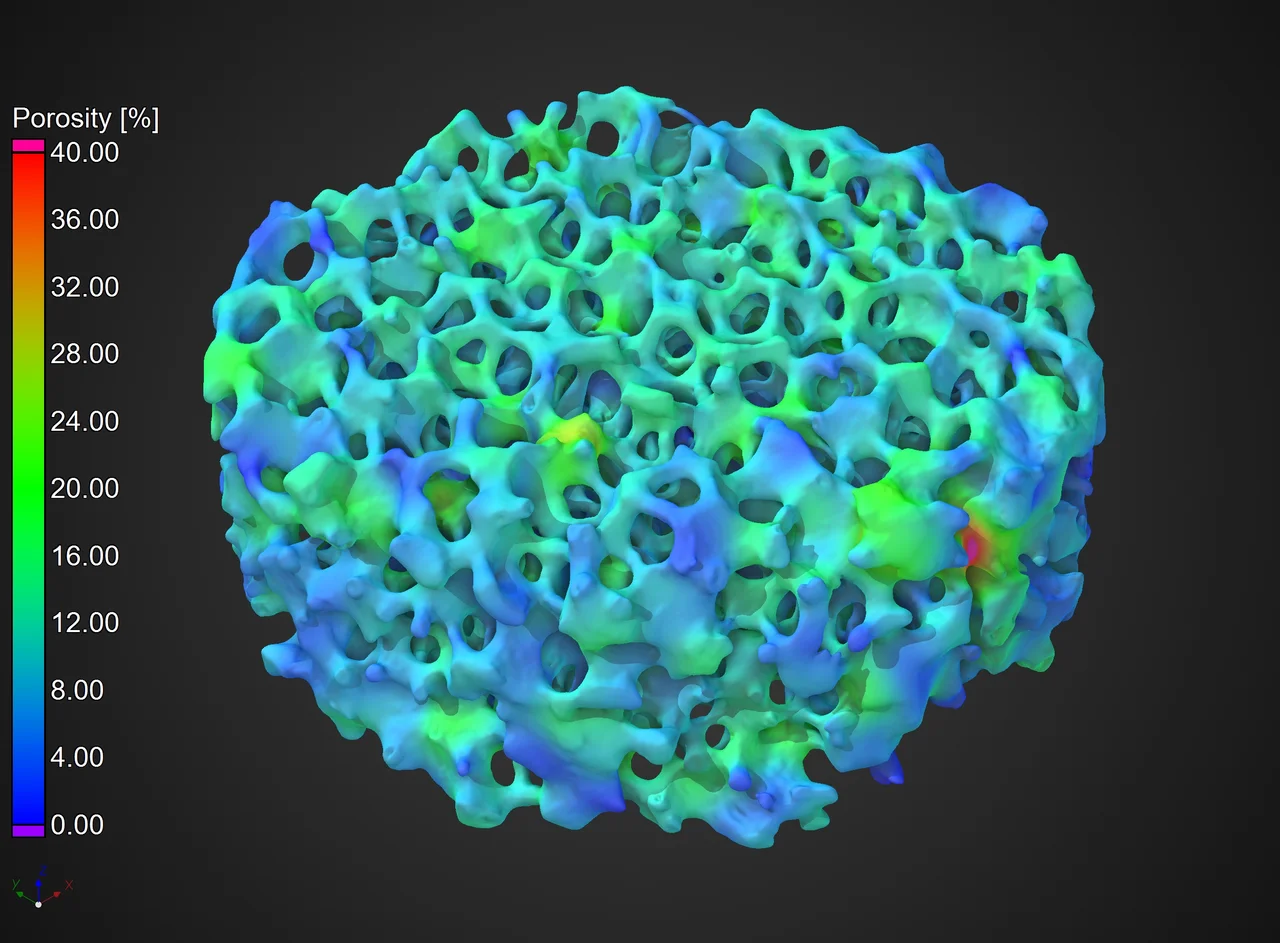
Porosity/inclusion analysis shows porosity distribution in ceramic foam filter
Directional variability in our porosity/inclusion analysis shows that porosity wavers between 8 and 13%. It has quite a few ups and downs, but there are no drastic peaks that would be cause for concern. The porosity is generally lower in the center, which is caused by bigger cells pushing out the gas bubbles.
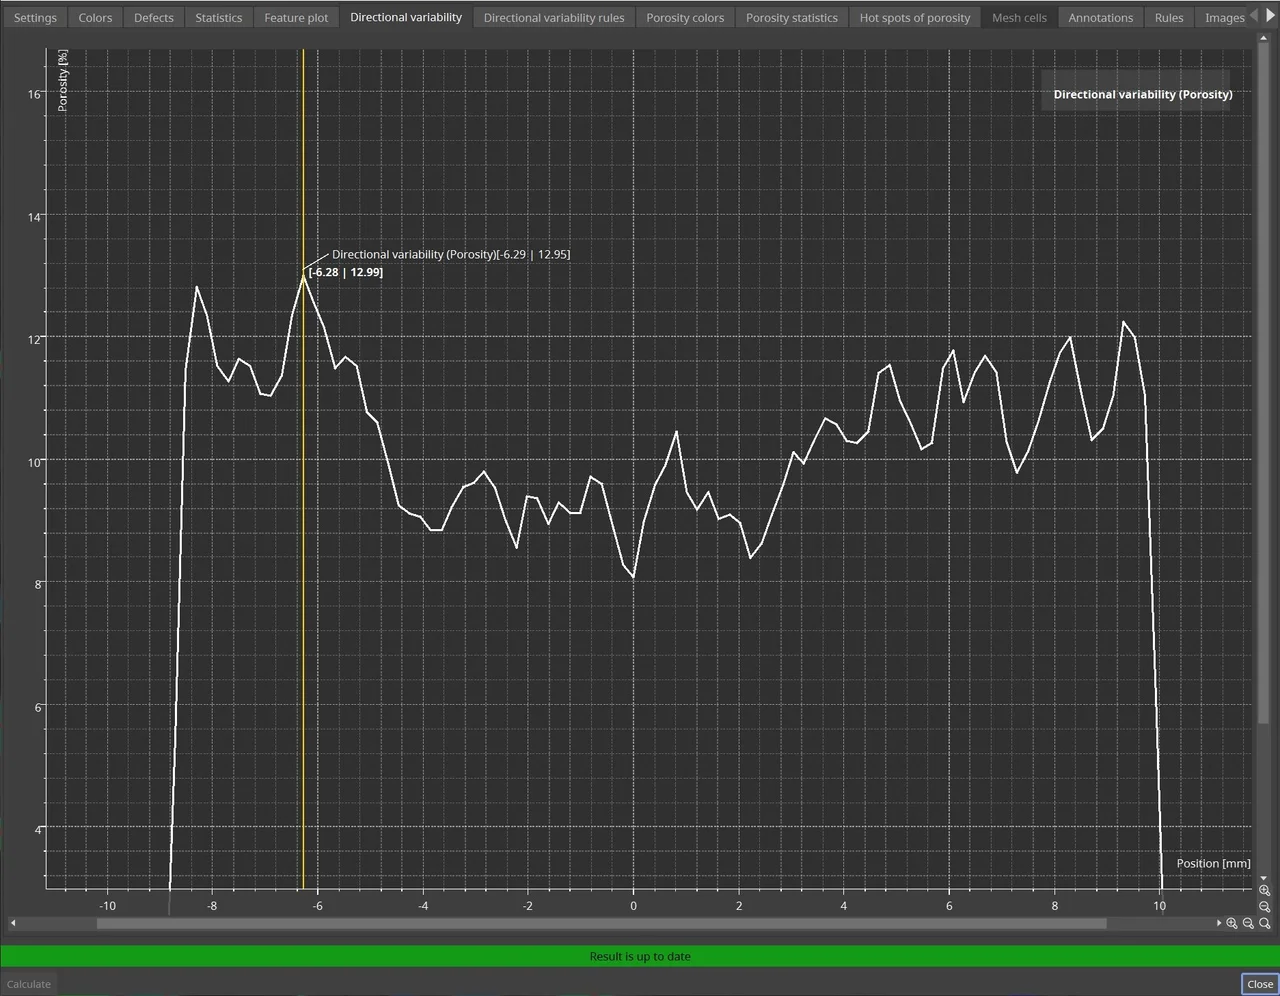
Directional variability line graph of our porosity/inclusion analysis; porosity wavers between 8 and 13%
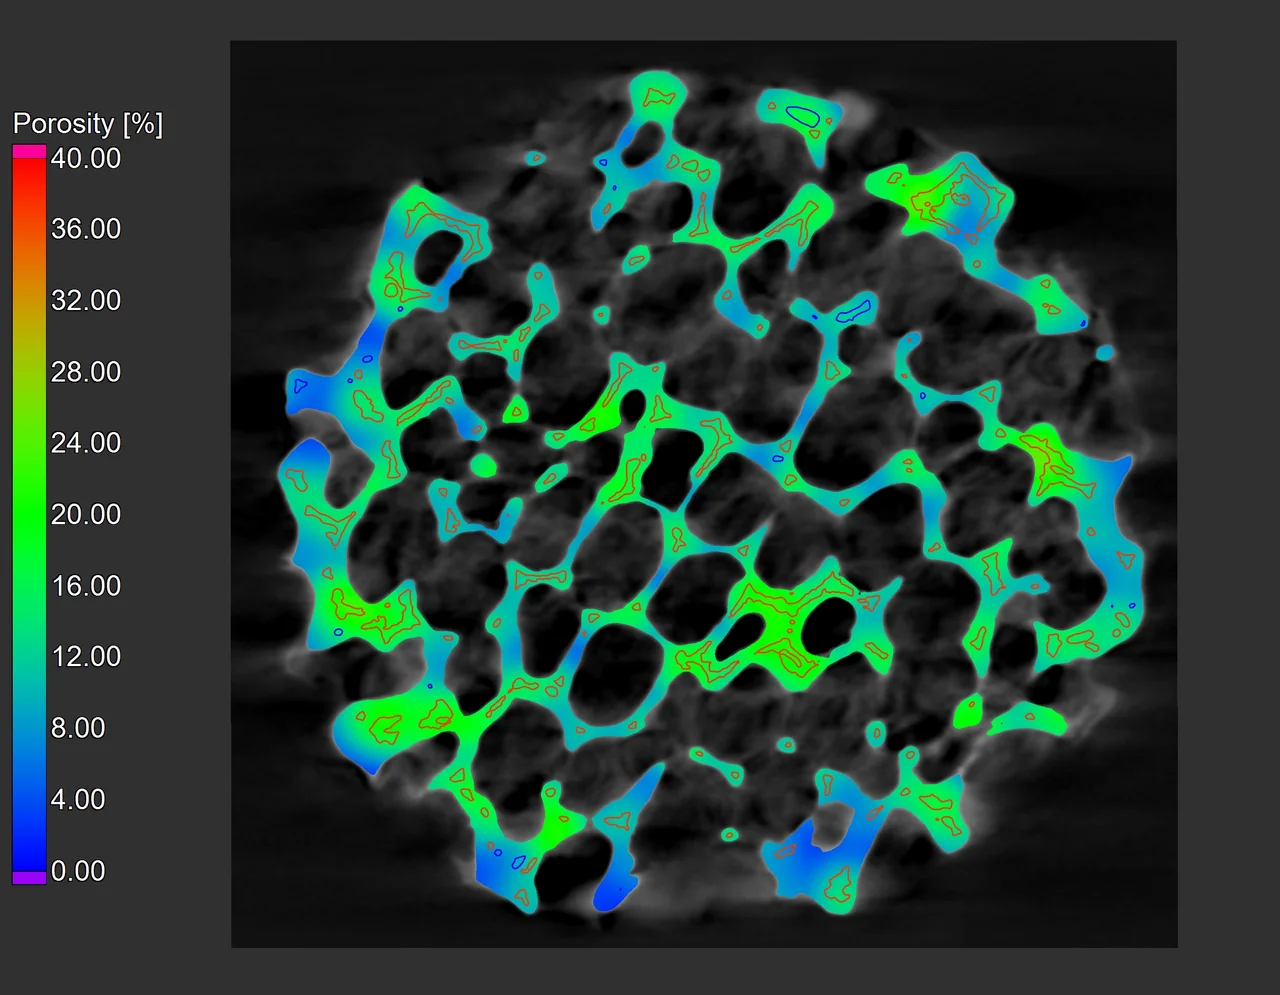
Results of the porosity/inclusion analysis
Gray Value Analysis

Gray value analysis shows gray values distribution in ceramic foam filter
As we've mentioned, we've also performed a gray value analysis to make sure there are no extremes in material gray values. The distribution is quite even; while it tends to sink towards the middle, it is insignificant and will not affect the part at all.
This indicates that there is no foreign material in the foam.
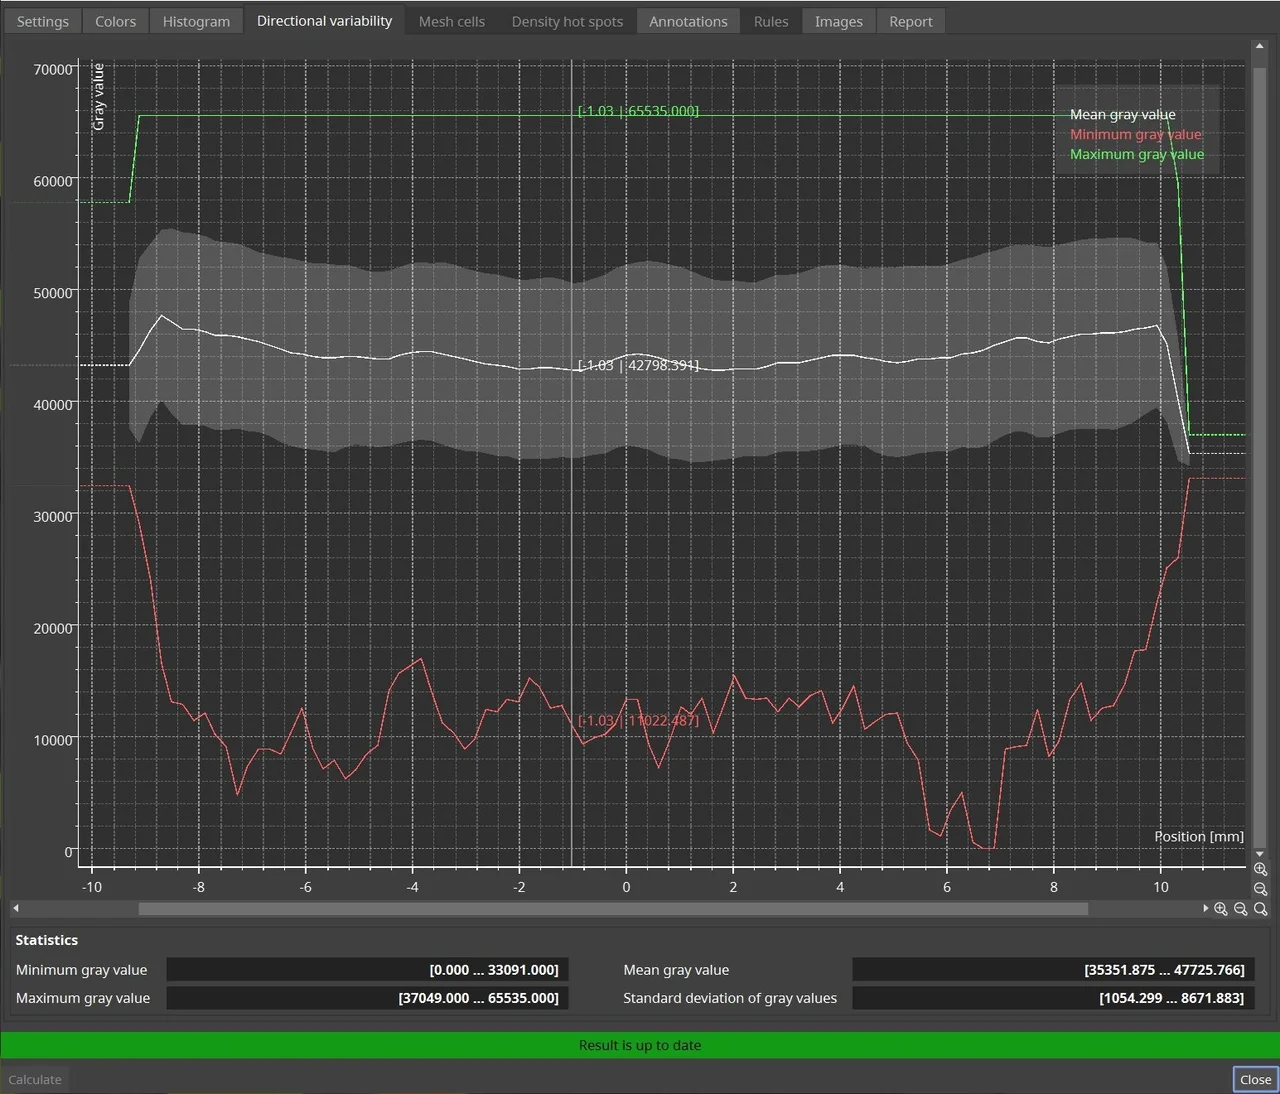
Directional variability line graph of our gray value analysis; the distribution is quite even, which means there is no foreign material in the foam

Results of the gray value analysis, color coded based on mean gray value; the values appear consistent
Embrace the Change
As with real life, change relies heavily on context—sometimes, we need to see how values change along a specific direction. Directional variability is especially useful for detecting anomalies, such as metal inclusions in a plastic part, or seeing whether there are strong variations in porosity.
Ready to Learn More?
Users of VGSTUDIO MAX can find out more about golden surfaces and mesh compensation in the tutorials included in the software.
Got a Story?
If you have a VG Story to tell, let us know! Contact our Storyteller Team at: storytellers@volumegraphics.com. We look forward to hearing from you.
