This page is not compatible with Internet Explorer.
For security reasons, we recommend that you use an up-to-date browser, such as Microsoft Edge, Google Chrome, Safari, or Mozilla Firefox.
VGSTUDIO MAX
Your Questions, Your VGSTUDIO MAX
No matter what insights you need to glean from your products, VGSTUDIO MAX will get you there. The modular software suite offers the complete spectrum of Volume Graphics functionality (CT reconstruction, GD&T, material analyses, and simulation).
Basic Edition
Your starting point is the basic edition of VGSTUDIO MAX. Even in its most basic edition, it offers:
Add-on Modules
Choose from a wide selection of modules for material analysis, geometry analysis, simulation, and CT reconstruction. And if your needs grow, check out the add-on modules for VGSTUDIO MAX.
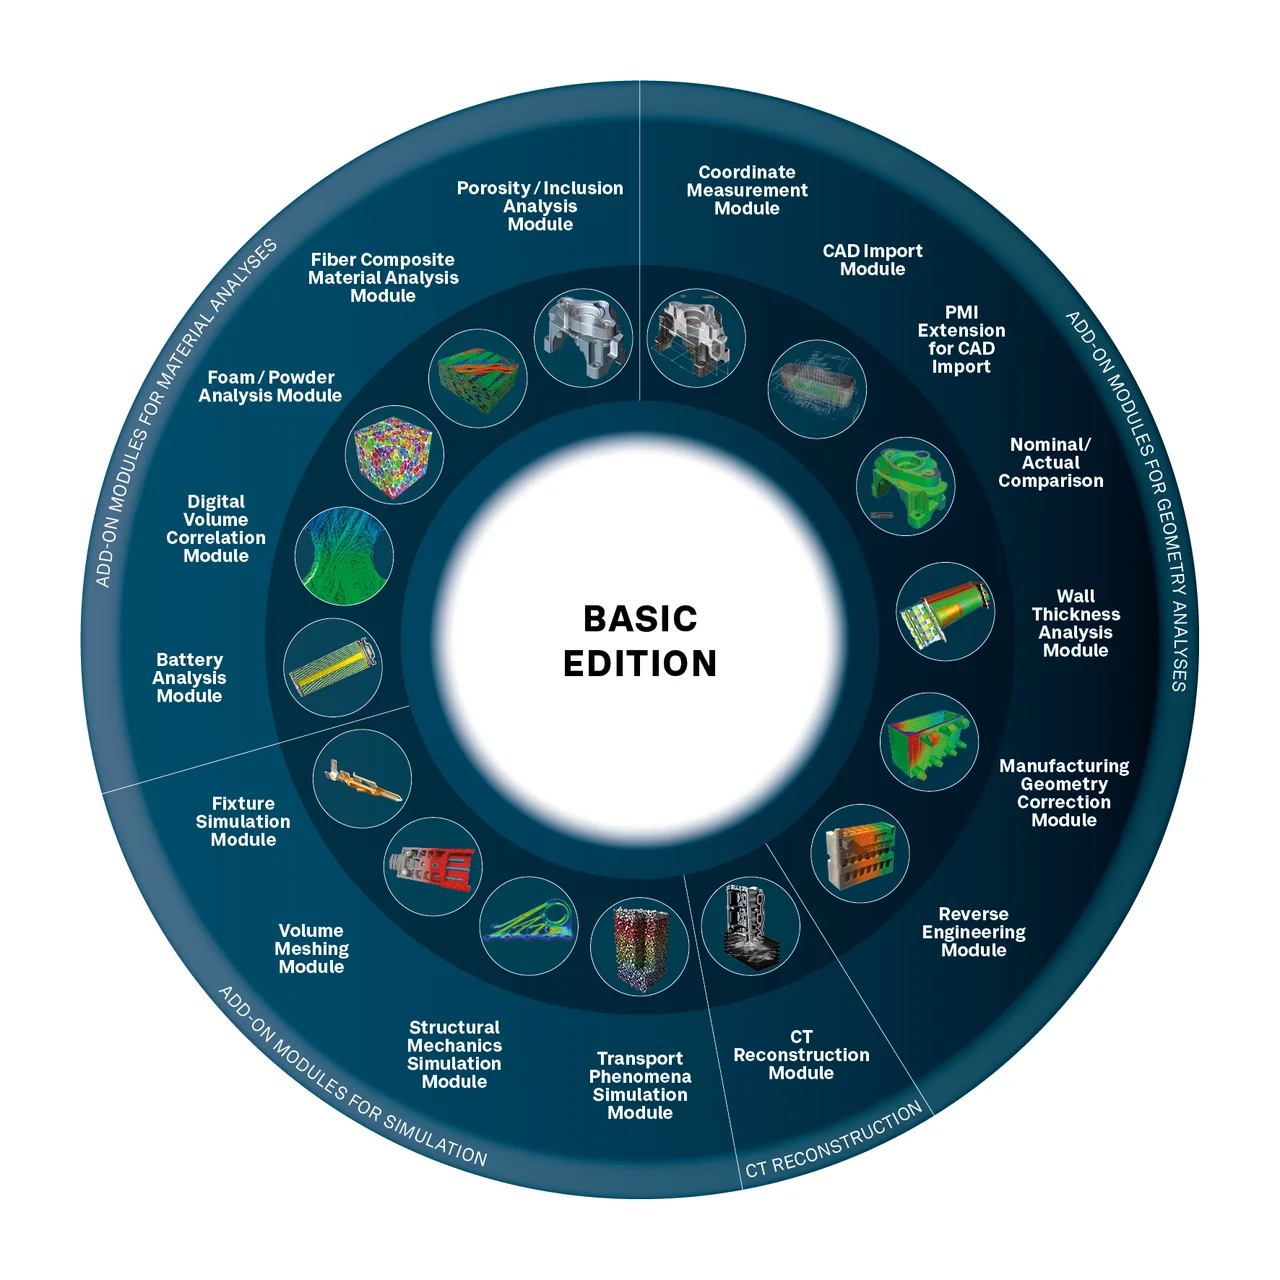
VGSTUDIO MAX offers a wide selection of add-on modules
Add-on Modules for Material Analyses
- Porosity/Inclusion Analysis Module for the non-destructive discovery of imperfections in castings, including the prediction of pore cuts. Analyses available according to the guidelines P 203, P 202, and P 201.
- Fiber Composite Material Analysis Module for the calculation of fiber orientations and other relevant parameters in composite materials
- Foam/Powder Analysis Module for cell structure characterization in porous foams and filter materials
- Digital Volume Correlation Module for quantifying displacements between initial and deformed volumes
- Battery Analysis Module for measuring 2D anode overhang on a wide array of battery types and scan qualities
Add-on Modules for Simulation
- Fixture Simulation Module has been designed to simulate the assembled state of a deformed part to replace the need of a CT scan of the part with a special fixturing device.
- Volume Meshing Module for the conversion of CT data to meshes for subsequent use in simulations
- Structural Mechanics Simulation Module for the simulation of mechanical stress directly on CT data
- Transport Phenomena Simulation Module for the simulation of fluid, electrical, or thermal flow and diffusion, such as on porous or composite materials:
Add-on Modules for Geometry Analyses
- Coordinate Measurement Module for measurements on even the most difficult-to-access surfaces of a component
- CAD Import Module for the import of native CAD files, such as CATIA V5 and Creo/Pro/ ENGINEER
- PMI Extension for CAD Import Module for the additional import of product and manufacturing information (PMI)
- Nominal/Actual Comparison Module for comparing manufactured parts with CAD, mesh, or other voxel data
- Wall Thickness Analysis Module for the localization of insufficient or excessive wall thickness or gap width
- Manufacturing Geometry Correction Module for the correction of tools for injection molding or casting and 3D printing geometries
- Reverse Engineering Module for the conversion of CT scans into CAD models that can be used in CAD systems
Add-on Modules for CT Reconstruction
- CT Reconstruction Modules for the reconstruction of 3D volume data sets using images taken by a CT scanner
Packages and Bundles
VGSTUDIO MAX Tailored to Your Area of Application
To make it easier for you, VGSTUDIO MAX is available in pre-configured packages tailored to the most common application areas. A package includes a VGSTUDIO MAX license, a selection of add-on modules, and a one-year update/service agreement. If you already own a VGSTUDIO MAX license, you can add a pre-configured bundle to your VGSTUDIO MAX. A bundle consists of a selection of add-on modules and a one-year update/service agreement.
- Preconfigured for the most common tasks across various industries
- Considerable savings compared to buying individual modules separately
- Package: includes a VGSTUDIO MAX license, a selection of add-on modules, and a one-year update/service agreement
- Bundle: consists of a selection of add-on modules and a one-year update/service agreement
For metrology and quality control across a broad range of industries
Includes these add-on modules:
- Coordinate Measurement
- Nominal/Actual Comparison
- Wall Thickness Analysis
For lightweight construction and materials research
Includes these add-on modules:
- Coordinate Measurement
- Porosity/Inclusion Analysis
- Fiber Composite Material Analysis
- Foam/Powder Analysis
For casting and injection molding (e.g., the automotive and aerospace industry)
Includes these add-on modules:
- Coordinate Measurement
- Nominal/Actual Comparison
- Wall Thickness Analysis
- Porosity/Inclusion Analysis
For industries working with plastic injection molding and fiber composite materials
Includes these add-on modules:
- Coordinate Measurement
- Nominal/Actual Comparison
- Wall Thickness Analysis
- Porosity/Inclusion Analysis
- Fiber Composite Material Analysis
For the inspection of additively manufactured parts, including powders
Includes these add-on modules:
- Coordinate Measurement
- Nominal/Actual Comparison
- Wall Thickness Analysis
- Porosity/Inclusion Analysis
- Foam/Powder Analysis
For the inspection of batteries, including finding and quantifying porosity, inclusions, anode overhang, and delamination.
Includes these add-on modules:
- Coordinate Measurement
- Nominal/Actual Comparison
- Wall Thickness Analysis
- Porosity/Inclusion Analysis
- Battery Analysis
For advanced users in quality assurance labs who face different analysis and measurement tasks as part of their daily work
Includes these add-on modules:
- Coordinate Measurement
- Nominal/Actual Comparison
- Wall Thickness Analysis
- Porosity/Inclusion Analysis
- Manufacturing Geometry Correction
- Fiber Composite Material Analysis
- Foam/Powder Analysis
- Volume Meshing
- Structural Mechanics Simulation
- Reverse Engineering
- Digital Volume Correlation
- CT Reconstruction (Cone/Fan/Parallel Beam, Special Algorithms (Helix, ART), and Planar)
For advanced users who need it all
Includes these add-on modules:
- Coordinate Measurement
- Nominal/Actual Comparison
- Wall Thickness Analysis
- Manufacturing Geometry Correction
- Reverse Engineering
- Fixture Simulation
- CAD Import*
- PMI Extension for CAD Import*
- Porosity/Inclusion Analysis
- Fiber Composite Material Analysis
- Foam/Powder Analysis
- Digital Volume Correlation
- Volume Meshing
- Structural Mechanics Simulation
- Transport Phenomena Simulation
- Battery Analysis
- CT Reconstruction (Cone/Fan/Parallel Beam, Special Algorithms (Helix, ART), and Planar)
- IAR** for CT Reconstruction
*CAD Translation Technology supplied by Tech Soft 3D
**Technology licensed by Fraunhofer EZRT
Ever-Evolving
VGSTUDIO MAX is always getting better, with new features rolling out regularly. With our update/service agreement, you can keep up with current developments in the analysis and visualization of industrial CT data while still saving money compared to the regular upgrade price.
Try VGSTUDIO MAX for free.
Start your 4-week evaluation now.
