This page is not compatible with Internet Explorer.
For security reasons, we recommend that you use an up-to-date browser, such as Microsoft Edge, Google Chrome, Safari, or Mozilla Firefox.
With the Volume Graphics product family – consisting of VGSTUDIO MAX, VGSTUDIO, VGMETROLOGY, VGinLINE, and myVGL – all kinds of analyses and visualizations can be carried out directly on data from industrial computed tomography (CT).
Version 3.1.1: Keep an Eye on Production Quality Everywhere
Volume Graphics, a provider of leading analysis and visualization software for industrial computed tomography (CT) data, introduces the long-anticipated possibility to manually re-evaluate results in VGinLINE in the latest update. The update to version 3.1.1 of Volume Graphics software brings valuable improvements that make daily work even easier for all users. Users of VGinLINE benefit from the new VGinLINE APPROVER, which makes it remarkably easy to take a second look at the results of an automated CT inspection.
VGinLINE Now with Web App for Manual Re-Evaluation
A manual re-evaluation of automated test results may be mandatory for safety-relevant parts. In addition, a manual re-evaluation can minimize scrap if the expert eye considers some cases of automatically rejected parts to be of sufficient quality. That's why the latest version of the fully automated CT inspection software VGinLINE comes with the comfortable web application VGinLINE APPROVER, which allows you to review and manually re-evaluate inspection results.
VGinLINE saves the automatically generated inspection results, measured values, 2D views, and metadata in a password-protected database. Auditors with access rights can view the data from their desktop PC or mobile device – conveniently in any modern web browser. If necessary, an auditor can manually change the pass/fail decision of the entire part or individual inspection features (e.g., defects or dimensions). The results of the manual inspections are stored in the database together with the information about the auditor.
In the "Inbox" of VGinLINE APPROVER, you'll find an overview of all manufactured parts that have been checked with VGinLINE and their respective tolerance status (OK/NOK status). These can be sorted or filtered, for example, by series, serial number or date of the automated test to select individual parts for a random manual re-evaluation, or to distribute the results among different users.
For each part, VGinLINE displays the automatically generated images according to the rules defined in the analysis, e.g., the dimensions that are out of tolerance or the three largest defects (Fig. 2). You can comment on the manual re-evaluation of individual inspection features and the global tolerance status.
Use the overviews of a series' automated inspection results to assess production quality. The overviews are available as a statistical distribution for the global toleration status (Fig. 3). Time series for the results of the individual inspection features such as dimensions or number of defects allow you to detect trends at an early stage (Fig. 4).
Availability of the New Version
VGSTUDIO MAX 3.1.1, VGSTUDIO 3.1.1, VGMETROLOGY 3.1.1, and VGinLINE 3.1.1 are available now. Volume Graphics is happy to provide quotes upon request.
Volume Graphics offers free evaluation versions of VGSTUDIO MAX 3.1.1, VGSTUDIO 3.1.1, and VGMETROLOGY 3.1.1 for temporary use.
myVGL 3.1.1 is available free of charge and can be requested on the Volume Graphics website.
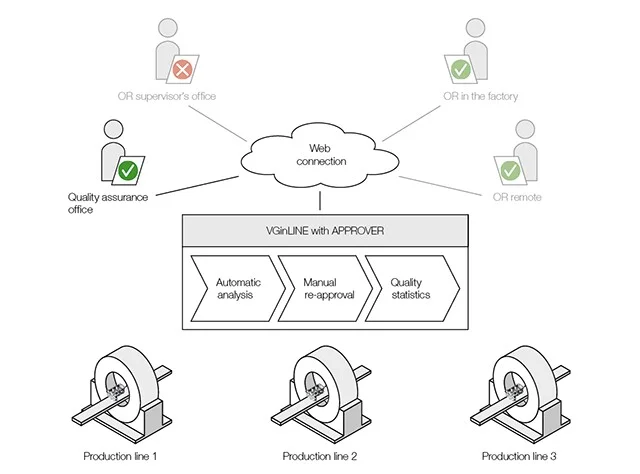
Figure 1: Monitoring and manual re-evaluation of the results of automated CT inspections with the VGinLINE APPROVER
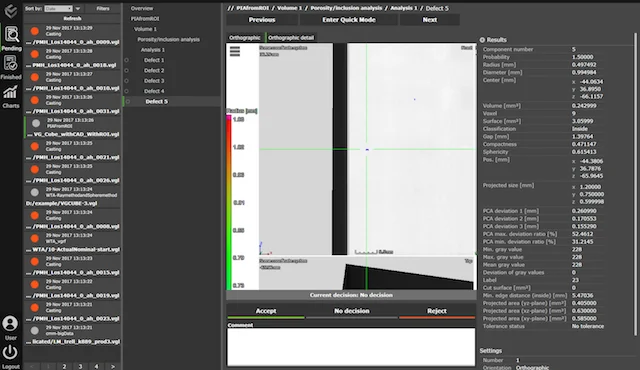
Figure 2: A pending manual re-evaluation in VGinLINE APPROVER (shown here: a defect found in an automated porosity analysis of a cast part)
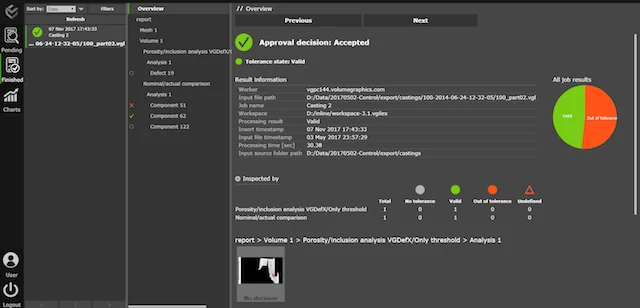
Figure 3: Statistical distribution of the global tolerance status of the individual parts of a series
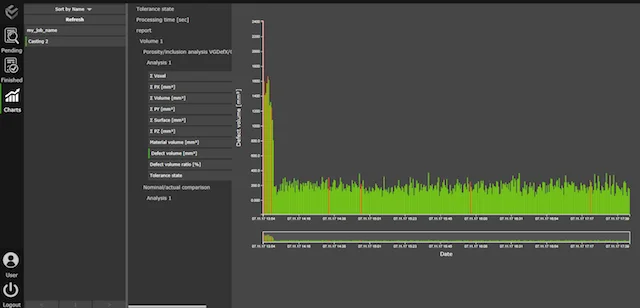
Figure 4: Time series of automated analysis results of an inspection feature for the items in a series (shown here: defect volume)